
I’m just going to get straight to the point – today I’m here to lower your expectations about people analytics, and that’s not a bad thing. Why do I say that? Well, it’s pretty simple – analytics seems complicated. Conversations about it usually start with the most sophisticated levels of analytics activities; you know, things like data science, predictive algorithms, prescriptive recommendation engines, and so on.
These are all great, but when you’re an HR leader juggling a million other priorities, just keeping things afloat through basic reporting seems challenging enough. I’ve got good news, though. You don’t have to speed your HR analytics straight from zero to 100. There are a bunch of easier incremental steps you can take to build up people analytics capabilities over time, and the best part is you’ll end up with a better understanding of your HR data as a whole thanks to this more gradual process. Let’s explore how.
Think in Tiers
Part of making people analytics manageable is separating it into different levels of activities. At Kronos, we like to think about this in terms of a pyramid with different tiers.
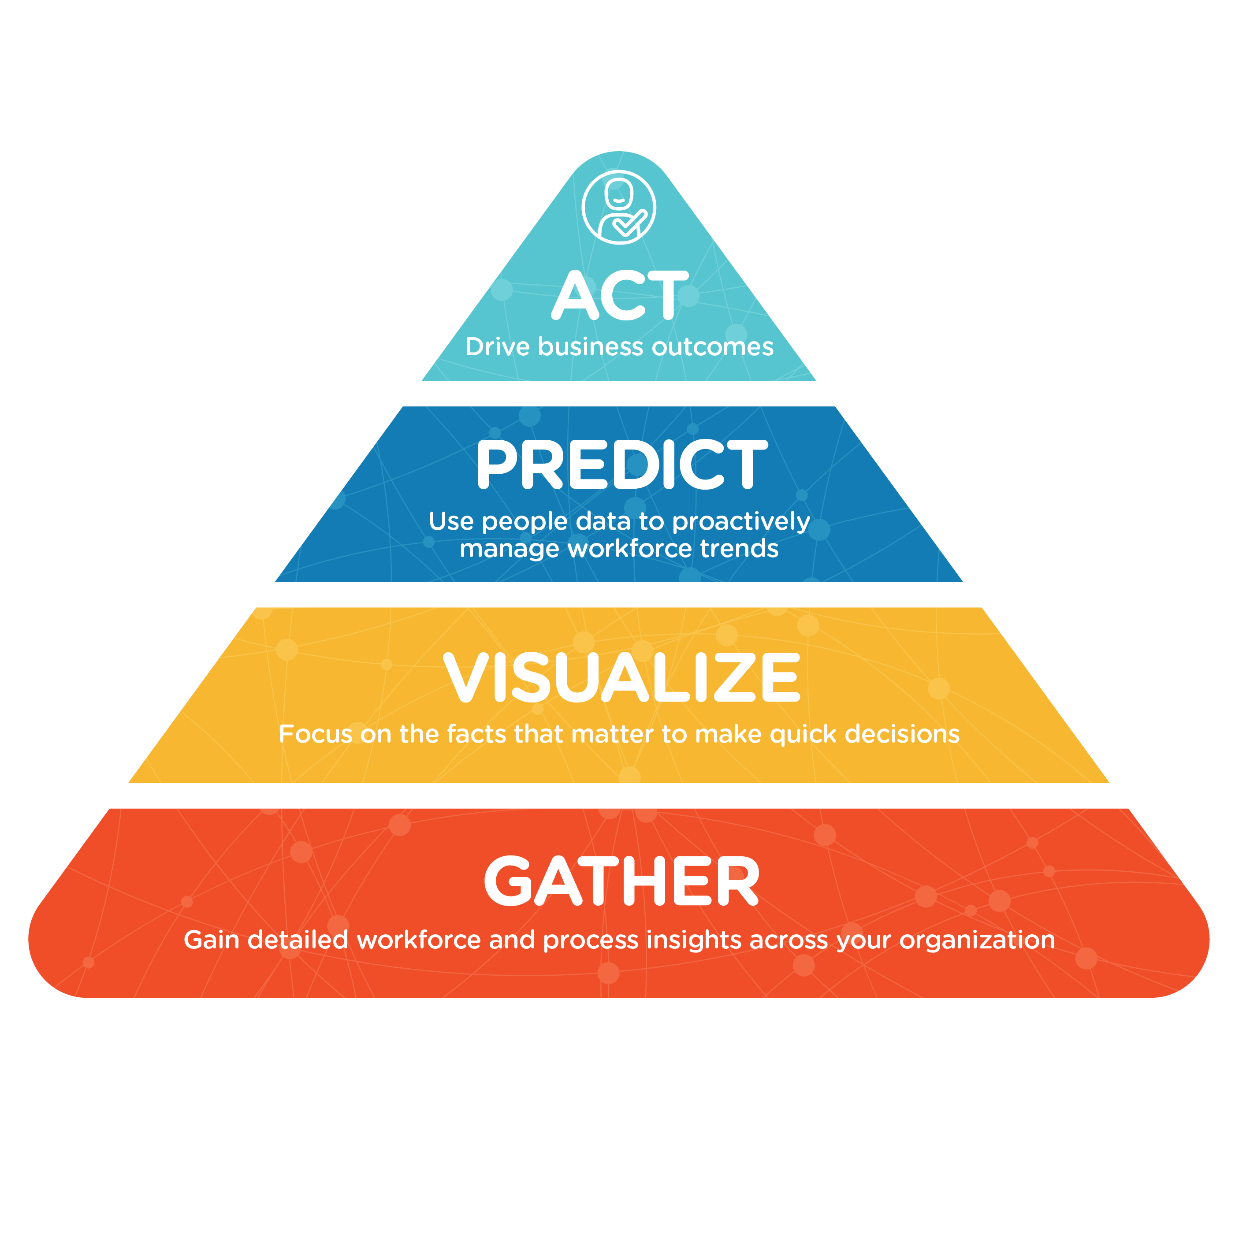
The idea here is to start with foundational processes around your HR data and then add layers of refinement that expand what you can do with that data. This journey begins with gathering the right details on your historical and current activities, which is what most of us know as reporting.
That’s right, reporting is the first step, and you’re probably already doing at least a little of it. Getting some strong, detailed views up and running for your core areas of focus will help you gather and isolate your key metrics and let you start watching what patterns occur regularly in your organization. Two elements are most important for this first big push to understand your HR data:
- Ask the right questions: Talk to your stakeholders in the organization and ask what they’re seeing on a daily basis. What kinds of information would help them succeed in their roles? Getting a pulse on these needs will help you focus on the right set of reports and metrics.
- Get clean data: This sounds scary, but it’s not. All it means is you need to be sure your HR data is coming from a reliable source. Having all your HR processes run off a single platform helps a lot here, since it means all your information goes to one place regardless of if it’s from HR, payroll, or time and attendance processes. It saves you from having to manually pull data from different tools and locations and reconcile the numbers, which can take a lot of time.
Think Visually
A big part of what makes people analytics a powerful resource is being able to act on what your HR data is telling you quickly. That’s why once your reporting foundation is in place you’ll want to focus on how you make those line-by-line details easy to consume fast and apply the insights you get from them. The answer here is to visualize it.
Charts and dashboards let your stakeholders see what’s important at a glance, which means they can make decisions at the right times rather than having a search through a bunch of tabular information delay them. In fact, according to Aberdeen, organizations that have real-time visualizations are able to get critical data within their decision window 78 percent of the time, which is 22 percent more often than organizations that don’t have them. Ideally, the HR technology you use should make it easy to add charts over your reports or create dashboards showing several charts with key metrics from areas across the full human capital management Coeur as a heads up display.
Think Proactively
Having the ability to respond quickly to real-time people analytics insights through visualizations gives you the extra cycles needed to take the next step and start proactively addressing workforce trends before they affect you. Now, I know this part is starting to sound like those big complex projects I mentioned earlier, but I promise there are ways to start predicting what will happen in your organization without spending a ton of time and money. You just have to trust your instincts as an HR professional and know what you’re looking for.
At this point, thanks to the time you spent up front exploring your data, getting your baseline reports under control, and choosing your core metrics, you can start combining that information in ways that help you go beyond tactical daily operations and make strategic choices that anticipate your workforce’s needs. Here are a couple examples of how we’ve seen this applied to some traditional areas of HR:
- Proactively manage workforce trends: If you’ve got all your HR, payroll, and time keeping data in one place, you can create scores that reflect a variety of trends to watch. Things like employee happiness, reliability, and risk of turnover (among many others) all become possible to calculate when you start combining the metrics you use in different areas of human capital management and visualizing them. Paying attention to these at the individual employee and group levels over time lets you anticipate what’s happening in your workforce and act to influence it in a positive way.
- Plan for succession: By defining some clear requirements around the different roles in your organization and tracking what qualifications different individuals have for specific positions, you can build a map of which people in various departments are likely candidates for promotion or greater responsibility. With the right HR system, you can even visualize this as a 9-box grid and automate the core criteria for the different levels of succession readiness to populate the grid and change it over time with minimal human input. Knowing this information ahead of time lets you plan for changes in senior staff, invest in developing the right team members, and be ready to fill the vacuum with a new leader when needed. The scores from the last point can also be a big help here.
These are only a couple examples of predictive projects that can capitalize on what you’ve already done with your data and make a difference in a short time.
Bringing It All Together
I hope at this point people analytics seems like something that’s more attainable than it did when you started reading. Just keep in mind through the whole process that the goal at the end is action. Every insight you gather from reporting all the way through to predicting should contribute to measurable positive changes for your organization.
In fact, that’s the ultimate final step once you get the information in your functional area under control – expand that data into the wider business context. Bringing in relevant metrics from other systems, like revenue or budget targets, is a great way to show how people data impacts business goals. Find the time for some small incremental changes now, and before you know it you’ll have a full-fledged people analytics ecosystem working for you.
The writer for this article is Keen Hahn – Product Marketing Manager


